Digikala Seller Growth Coach

A guided path for growing Digikala's sellers

About Project
The Seller Growth Coach project aimed to provide sellers with insights into their performance and suggest actions for improvement. Performance was evaluated based on seller sales and their operational journey on Digikala. Initially, the project addressed sales-related issues and performance gaps, followed by operational challenges. Operations encompassed various areas such as order return, delivery, and cancellation. The first step focused on resolving issues related to order returns.
Year
2023
My Role
Design Team Lead
Product Designer

A Brief History

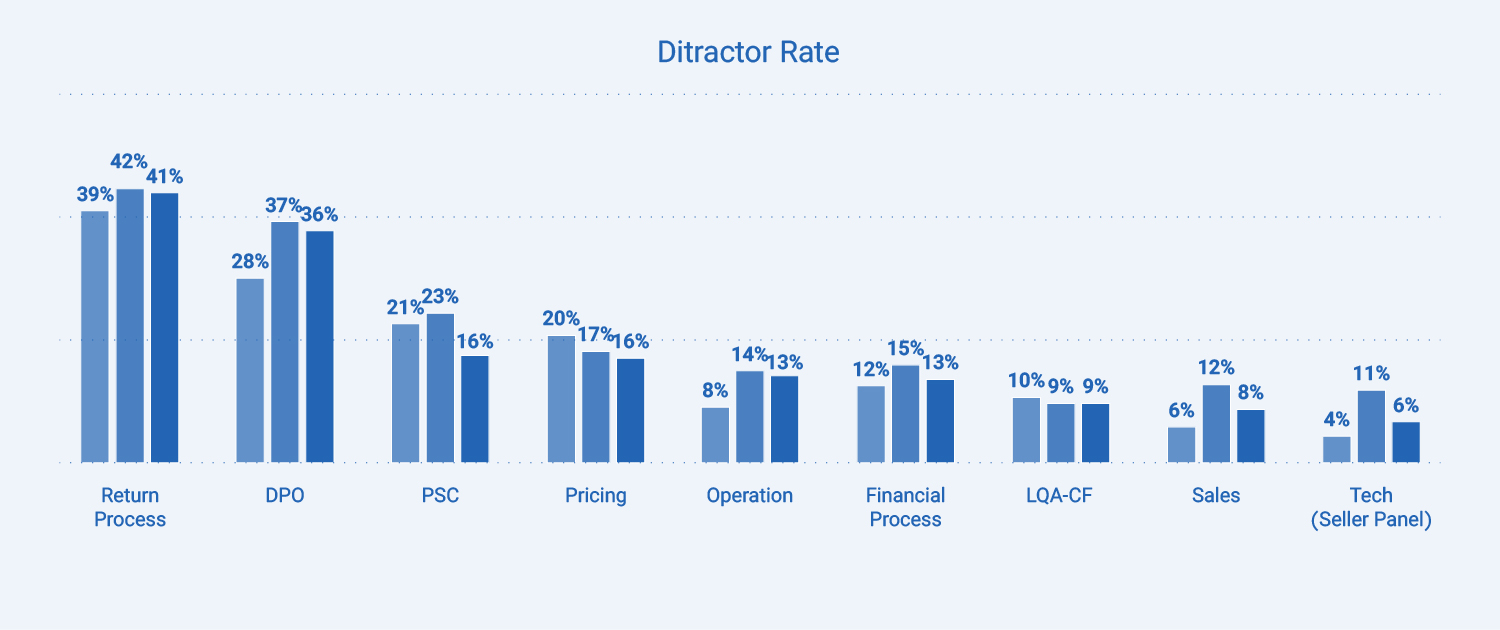
We conducted a quarterly general survey to identify sellers' problems, and the results from the last quarter revealed that the most frequent source of dissatisfaction was related to order


7016 sellers participated
in this survey out of 43877 sellers who had at least one product for sale on the DigiKala website in the last year (2022).

Data Gathering

We also inquired about why users selected order returns as the most problematic issue and what specifically dissatisfied them within the order return flow.
  • Damaged returned items are not carefully inspected.
  • The reason for the return is unclear.
  • Mixing returned items with other products.
  • Poor inspection of returned items packaging.
  • Some of the returned items are missing.
  • Lack of a return reason note accompanying the product.
Since the project was new and complex, our initial focus was on collecting data about user behavior and understanding how this flow fits into Digikala's model. We conducted user interviews and involved stakeholders to gather different viewpoints. Additionally, we held regular focus group meetings with various user types to gather insights and feedback. These efforts helped us understand the project and user needs thoroughly before moving forward.

Problem Statement

Sellers often lose a significant portion of their revenue due to order return penalties. This occurs because they lack insight into why their products are being returned by customers and what actions they can take to reduce their return rate.
In Digikala
  • Order returns come with penalties for sellers, and products with high return rates are deactivated for selling by Digikala agents.

Ideation

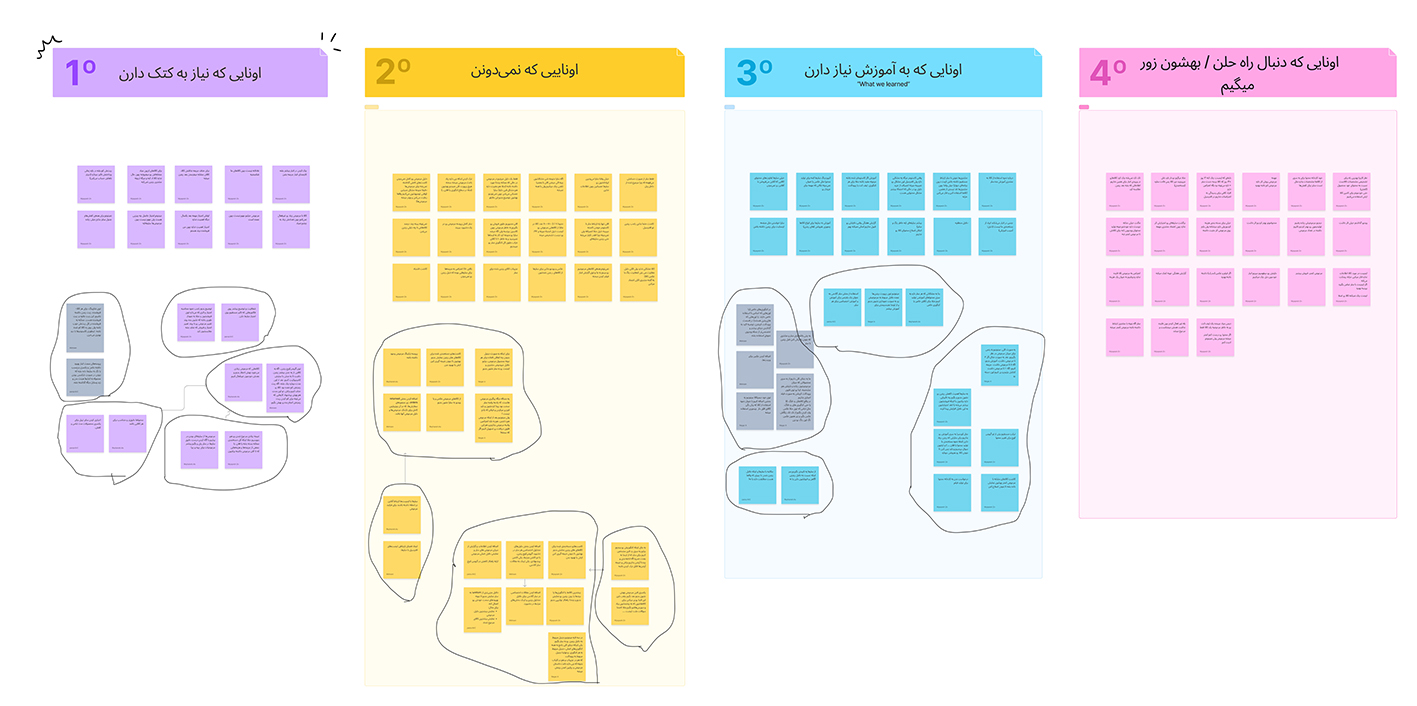
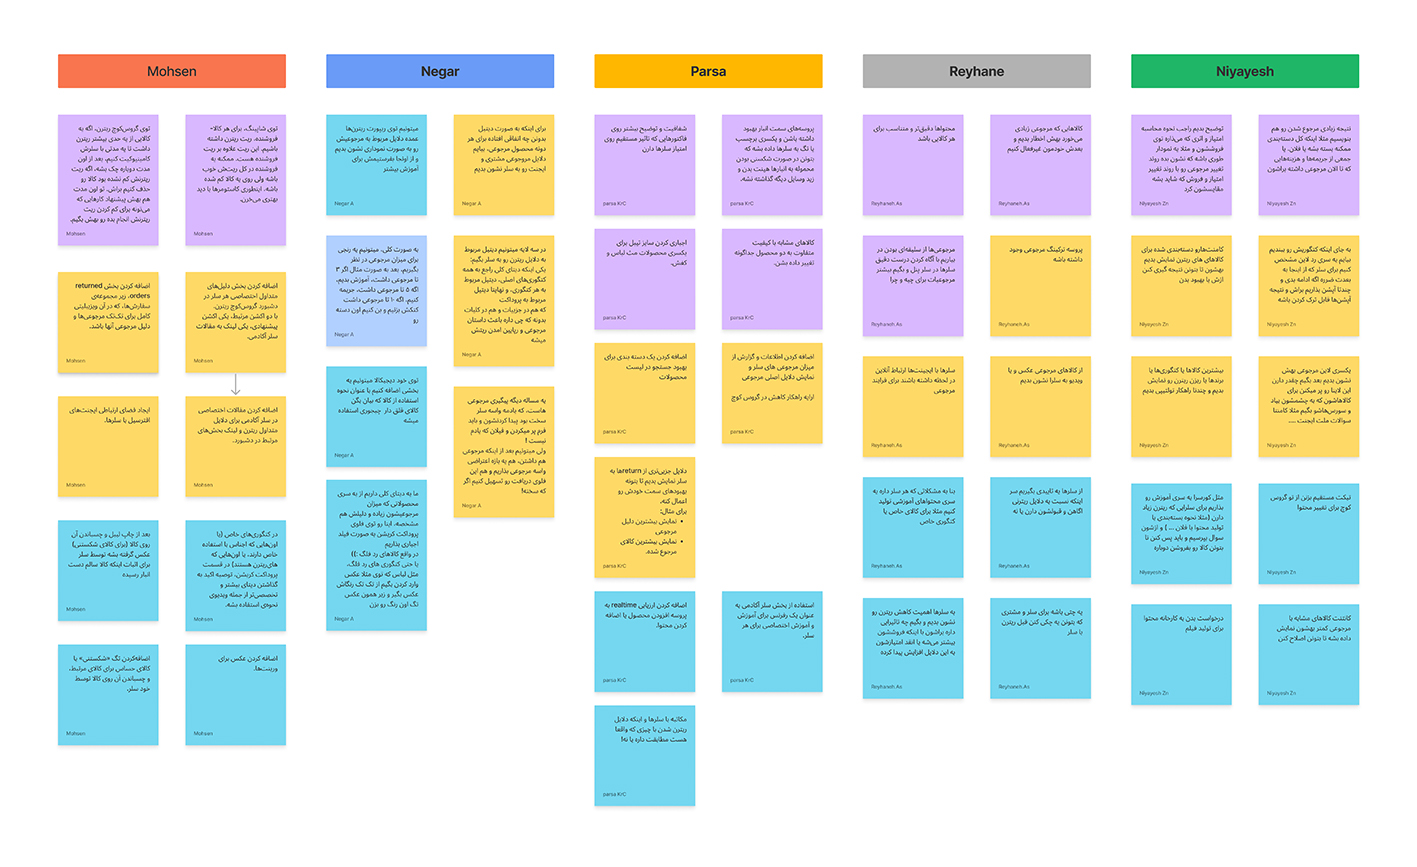
After gathering all the data, we created an affinity diagram to organize the pain points. In the ideation step, I conducted brainstorming sessions with other product designers in my team to generate solutions.

  • Those who need a push
  • Those who are clueless
  • Those who need guidance
  • Those looking for solutions/convincing
Affinity DiagramIdeation Board
  • We conducted a benchmark for similar products and discovered that the most crucial aspect of coaching features is providing users with specific products requiring attention and touch-points to actions to enhance seller performance.
After analyzing the data, we concluded that the problem could be addressed through two distinct flows. One would be integrated into the growth coach, where we provide insights and data to users. The other would involve a comprehensive report on returned orders with detailed information. Due to the current stage of the project, we could only address some of the issues.

The solution

In my opinion, the solution lies in clarifying the process of returned orders for sellers. The lack of transparency on certain details from the business side has damaged sellers' trust in Digikala's decision-making and judgment.

This lack of clarity has also made sellers hesitant to make improvements in their product delivery.

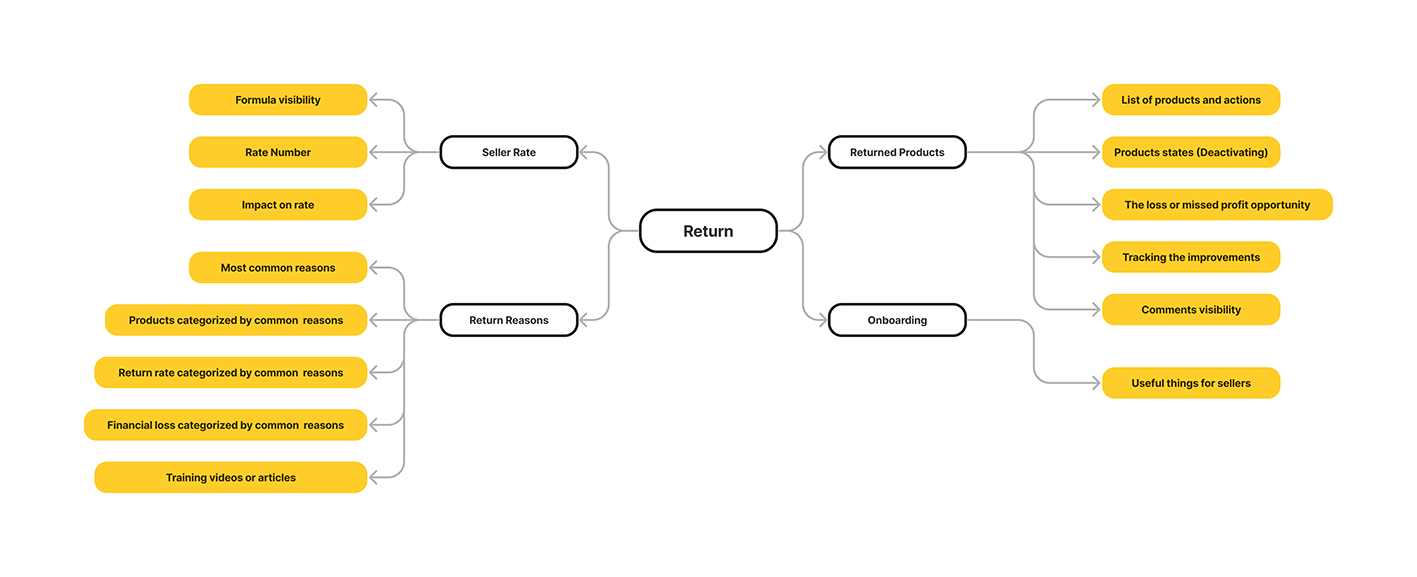
At this stage of feature development, we've identified four key solutions that will function together as a system for sellers.

These four solutions correspond to the answers to four important questions for sellers. And created the information architecture!
1. which products are at risk of deactivation?
2. why products are being returned?
3. What actions can I take to decrease returns?
4. What impact does product returns have on my performance?
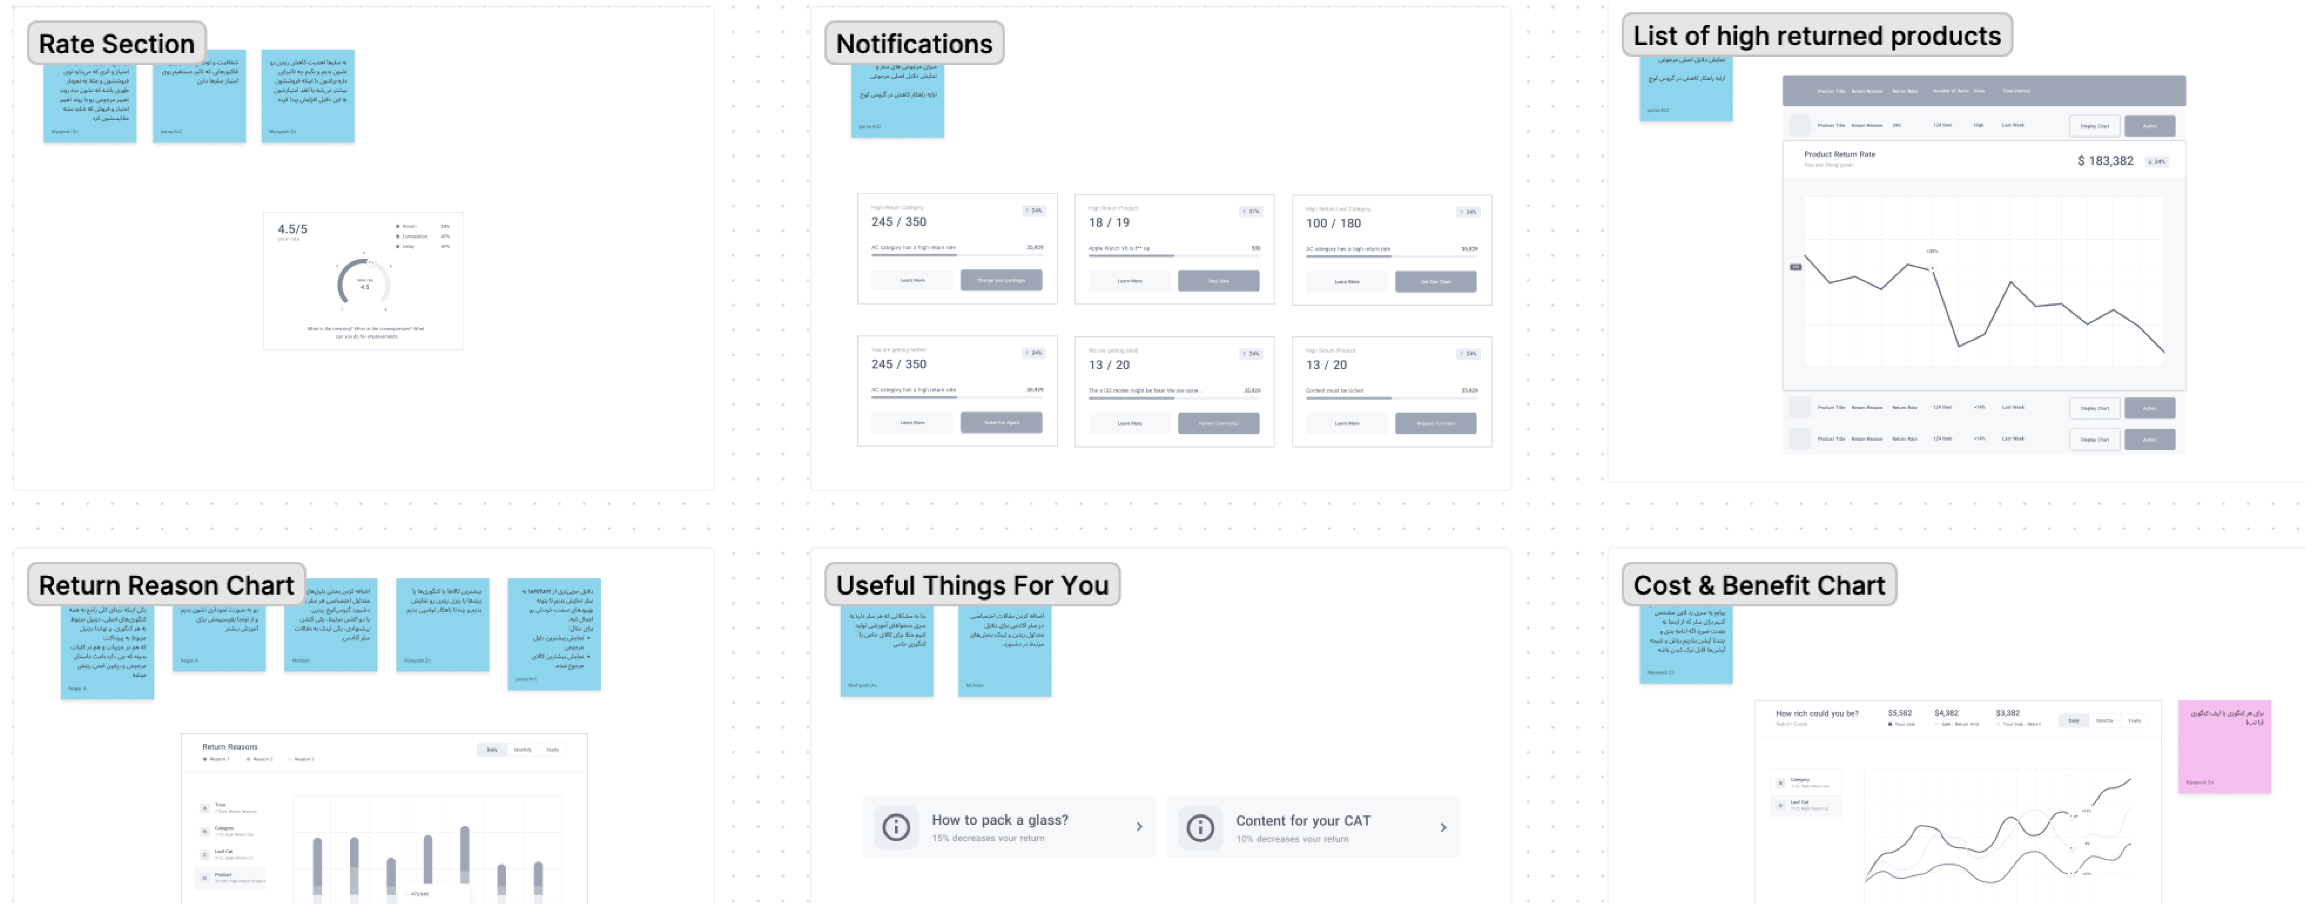
In this project, we developed wireframes for each solution component individually. These wireframes were then shared with both the product and technical teams. They provided feedback and suggested edits aimed at streamlining the project scope and reducing development time.

How we evaluated the solution
Afterward, we evaluate our solutions to assess their usability.

Evaluation Method:
Qualitative Usability Test
Number of sellers participating:
10 sellers
User segments:
Shared with another project test
Main questions in evaluation were:
1- Do sellers have a clear understanding of the data presented on this page?
2- Are the data on this page practical and usable for them?

Overall impression:
Upon entering this page, individuals felt pleased and believed that it could significantly enhance their workflow. Some of them inquired about the implementation timeline for this page.
Results

Achieved a 42% reduction in seller returns within six months.

Want to get in touch?
Drop me a line!

Thank you! Your submission has been received!
Oops! Something went wrong while submitting the form.